Categories
common assays

Polymerase chain reaction (PCR)

Overview

Polymerase Chain Reaction (PCR) is a powerful molecular biology technique used to amplify specific segments of DNA. It allows scientists to make multiple copies of a specific DNA sequence from a tiny amount of starting material. Like a digital photocopier, it enables researchers to amplify DNA segments exponentially, making it easier to analyze and study genetic material. PCR is instrumental in various research and diagnostic applications, helping researchers identify and analyze genes responsible for specific traits or diseases, study genetic variations, detect infectious agents, and conduct forensic investigations. It also aids in cloning DNA fragments and preparing samples for sequencing.

PCR is widely used in genetics, genomics, molecular biology, and biotechnology research. It plays a crucial role in fields such as genetic disease research, microbiology, evolutionary studies, and environmental monitoring.

Materials Required for PCR:

To perform a basic PCR, you’ll need a few key components:

  1. DNA Template: The DNA containing the target sequence to be amplified. Primers: Short DNA sequences that flank the target region and serve as starting points for DNA synthesis.
  2. DNA Polymerase: An enzyme responsible for adding nucleotides and building the new DNA strand.
  3. Nucleotides: The building blocks of DNA (A, T, C, G) required for DNA synthesis. Buffer Solution: Providing the optimal environment for the PCR reaction.
  4. Thermal Cycler: The PCR machine that automates the temperature changes needed during the reaction.
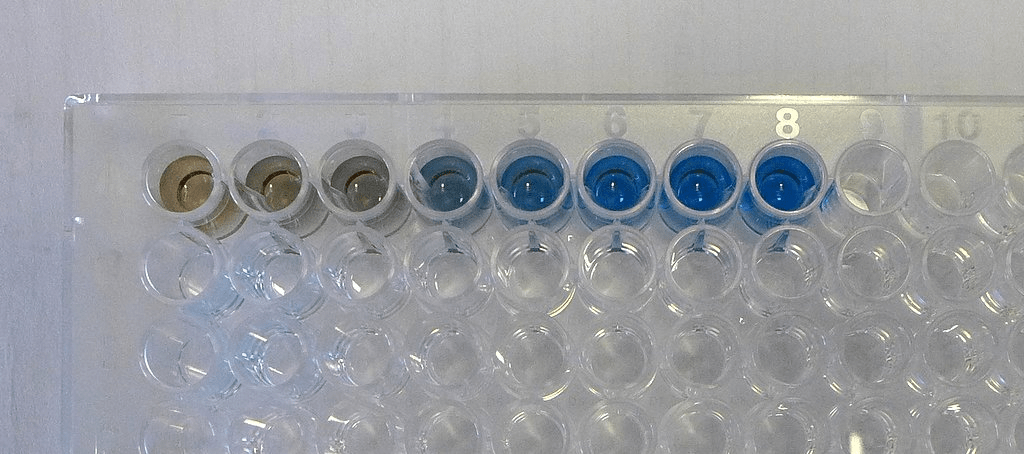
  5. Reaction Tubes: Small, thin-walled tubes where the PCR reaction takes place.

Basic Step-by-Step PCR Protocol:

Here’s a simplified outline of the PCR process:

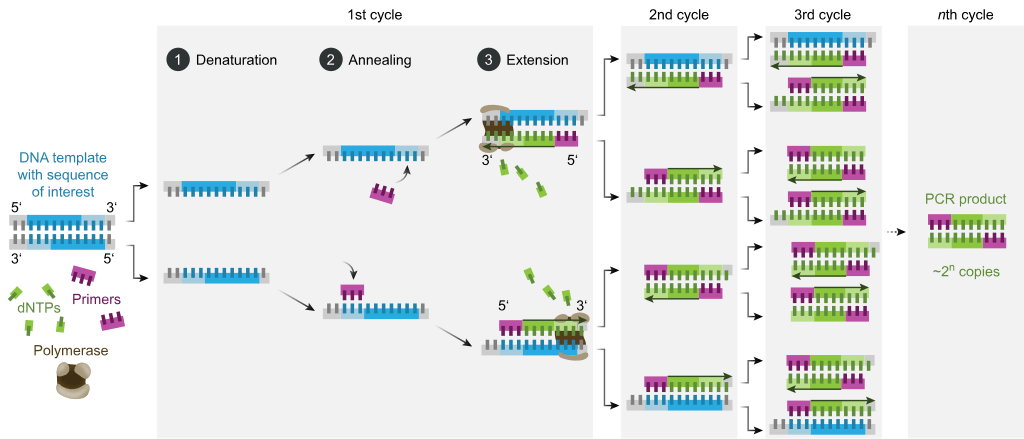
Denaturation: The reaction begins with heating the mixture to a high temperature (e.g., 94-98°C) to denature the double-stranded DNA, separating it into two single strands.

Annealing: The mixture is cooled to a lower temperature (e.g., 50-65°C) to allow the primers to anneal (bind) to their complementary sequences on each DNA strand.

Extension: The temperature is raised to an optimal range for the DNA polymerase (e.g., 68-72°C), which adds nucleotides to the primers, synthesizing new DNA strands.

Repeat: Steps 1-3 are repeated in cycles, typically 20-40 times, which leads to an exponential increase in the number of DNA copies of the target region.

Final Extension: After the last cycle, the reaction is held at the extension temperature for a short period to ensure completion of any partial DNA strands.

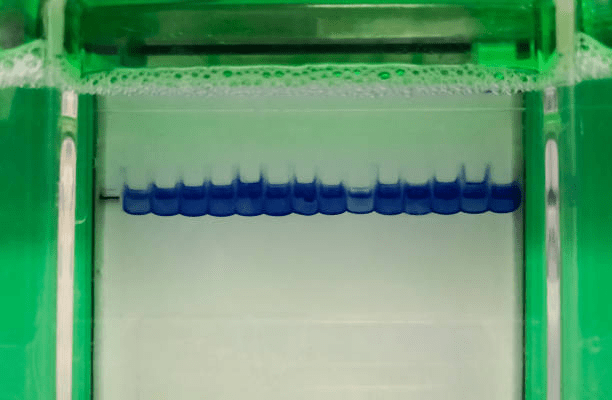
That’s it! Once the PCR is complete, you’ll have a substantial amount of amplified DNA, ready for analysis through gel electrophoresis, sequencing, or other downstream applications.

Categories
common assays

Western blotting

Let’s explore an overview of Western Blotting, a widely used technique in molecular biology and biochemistry for detecting specific proteins within a sample.

Introduction to Western Blotting: Western Blotting, also known as immunoblotting, widely used technique in molecular biology and biochemistry for detecting specific proteins within a complex mixture. This technique is valuable in understanding protein expression, post-translational modifications, and protein interactions.

It allows researchers to detect the presence and relative abundance of a particular protein of interest in a sample. It also helps in investigating changes in protein expression levels under different experimental conditions and provides insights into cellular processes and protein function.

Western Blotting finds applications in various fields of research, including cell biology, cancer research, immunology, neuroscience, and drug development. It is instrumental in studying disease biomarkers, protein-protein interactions, and the effects of different treatments on protein expression.

Materials Required for Western Blotting:

To perform a Western Blot, you’ll need several key components:

  1. Protein Sample: The mixture containing the proteins of interest, extracted from cells, tissues, or other biological sources.
  2. Electrophoresis Gel: A polyacrylamide gel used to separate proteins based on their size.
  3. Transfer Membrane (e.g., PVDF or nitrocellulose): The membrane onto which proteins are transferred from the gel.
  4. Primary Antibody: A specific antibody that binds to the target protein with high affinity.
  5. Secondary Antibody: Conjugated to an enzyme or fluorescent tag, this antibody binds to the primary antibody, facilitating detection.
  6. Blocking Agent: A solution that prevents non-specific binding of antibodies to the membrane.
  7. Washing Buffers: To remove unbound antibodies and other unwanted components.
  8. Detection Reagents: Depending on the secondary antibody, these reagents enable visualization of the protein bands.

Basic Step-by-Step Western Blot Protocol:

Here’s a simplified outline of the Western Blotting process:

  1. Protein Separation: The protein sample is loaded onto an electrophoresis gel and subjected to an electric field, which separates the proteins based on their size.
  2. Transfer to Membrane: After electrophoresis, the proteins are transferred from the gel to a solid membrane, typically using a technique called electroblotting.
  3. Blocking: The membrane is treated with a blocking agent to prevent non-specific binding of antibodies, ensuring they only interact with the target protein.
  4. Primary Antibody Incubation: The membrane is incubated with the primary antibody, allowing it to bind specifically to the target protein.
  5. Secondary Antibody Incubation: After washing away unbound primary antibodies, the membrane is incubated with the secondary antibody, which recognizes the primary antibody and is linked to an enzyme or a fluorescent tag.
  6. Detection: The presence of the target protein is visualized by adding a substrate that reacts with the enzyme or a fluorescence scanner in the case of fluorescent tags.
  7. Data Analysis: The resulting protein bands are analyzed to determine the abundance and size of the target protein.
Categories
common assays

Flow cytometry

Overview

Flow cytometry is a powerful technique used to analyze and sort cells based on their physical and chemical properties. It allows researchers to study individual cells in a heterogeneous population, examining various cellular characteristics simultaneously. Flow cytometry provides valuable information about cell size, complexity, granularity, and expression of specific molecules on the cell surface or inside the cell. It helps identify different cell types, study cell cycle phases, assess immune responses, and detect abnormal cells, among other applications. It’s extensively used in immunology, hematology, cancer research, stem cell studies, and drug discovery. It plays a crucial role in understanding cellular functions, diagnosing diseases, and monitoring treatment responses.

Materials and Instruments in Flow Cytometry:

To perform flow cytometry, you’ll need several key components:

  1. Cell Sample: The mixture containing the cells of interest, often labeled with fluorescent markers or antibodies.
  2. Flow Cytometer: The instrument used to measure and analyze individual cells as they flow through a narrow channel.
  3. Laser or Light Source: A light source that emits specific wavelengths to excite the fluorescent labels on the cells.
  4. Optical Filters: Filters that select specific wavelengths of light emitted by the fluorescent labels for detection.
  5. Photodetectors: Detectors that capture the emitted fluorescent light from each cell and convert it into electrical signals.
  6. Data Analysis Software: To process and interpret the complex data generated by the flow cytometer.

Basic Steps in Flow Cytometry:

Here’s a simplified outline of the flow cytometry process:

  1. Sample Preparation: The cell sample is prepared and labeled with fluorescent markers or antibodies specific to the cell characteristics of interest.
  2. Cell Suspension: The labeled cells are suspended in a liquid solution, allowing them to flow through the flow cytometer in a single file.
  3. Illumination and Detection: As cells pass through the flow cytometer, they are illuminated by lasers or light sources, causing the fluorescent labels to emit light. Detectors capture the emitted light and convert it into electronic signals.
  4. Data Collection: The flow cytometer collects data on multiple parameters for each cell, such as cell size, granularity, and fluorescence intensity.
  5. Data Analysis: The collected data is analyzed using specialized software, allowing researchers to identify and quantify different cell populations and their characteristics.
  6. Sorting (Optional): In some flow cytometers, cells can be sorted based on their characteristics. This process is called cell sorting and allows researchers to isolate specific cell populations for further study.
Categories
common assays

Mass Spectrometry

Overview

Mass spectrometry is a powerful analytical technique used to identify and analyze molecules based on their mass-to-charge ratio. It’s versatile and widely used analytical method in chemistry and biology that enables researchers to identify and quantify the composition of molecules present in a sample by measuring their mass-to-charge ratio. Mass spectrometry provides valuable information about the molecular weight, structure, and composition of various substances. It allows researchers to identify unknown compounds, study protein sequences, analyze metabolites, and determine the isotopic composition of elements. Mass spectrometry finds extensive applications in proteomics, metabolomics, pharmacology, environmental science, and forensic analysis. It plays a crucial role in drug discovery, biomarker identification, and studying complex biological systems.

Materials and Instruments in Mass Spectrometry:

To perform Mass Spectrometry, you’ll need several key components:

  1. Sample Preparation: The sample of interest is prepared, which may involve extraction, purification, or derivatization depending on the nature of the molecules being analyzed.
  2. Mass Spectrometer: The instrument used to measure the mass-to-charge ratio of ions formed from the sample.
  3. Ionization Source: A technique that converts the sample molecules into ions, which are then introduced into the mass spectrometer.
  4. Mass Analyzer: The part of the mass spectrometer that separates ions based on their mass-to-charge ratio.
  5. Detector: A component that detects and measures the ions’ abundance and generates mass spectra.
  6. Data Analysis Software: To interpret the mass spectra and identify the molecules present in the sample.

Basic Steps in Mass Spectrometry:

Here’s a simplified outline of the Mass Spectrometry process:

  1. Ionization: The sample is ionized using one of several ionization techniques, such as Electrospray Ionization (ESI) or Matrix-Assisted Laser Desorption/Ionization (MALDI).
  2. Mass Separation: The ions are accelerated into the mass analyzer, where they are separated based on their mass-to-charge ratio.
  3. Detection: The detector records the abundance of each ion, generating a mass spectrum that represents the different ions’ masses and intensities.
  4. Data Analysis: The mass spectrum is analyzed using specialized software to identify the molecules present in the sample based on their mass and fragmentation pattern.
  5. Quantification (if applicable): In quantitative mass spectrometry, the abundance of specific molecules is measured and related to their concentrations in the sample.

Its versatility and sensitivity have made it an indispensable technique in modern scientific research, driving discoveries in fields ranging from medicine to environmental science.

Categories
common assays

Spectroscopy

Overview

Spectroscopy is a powerful analytical technique used to study the interaction of matter with electromagnetic radiation, an essential analytical tool in the fields of chemistry, physics, and various other scientific disciplines. It involves the study of how matter interacts with different wavelengths of electromagnetic radiation, such as visible light, ultraviolet, infrared, or radio waves. Spectroscopy provides valuable information about the composition, structure, and properties of materials. It helps researchers identify chemical compounds, determine their concentrations, study molecular vibrations, and investigate electronic transitions, among other applications. Spectroscopy finds extensive applications in fields such as analytical chemistry, material science, astronomy, biochemistry, and environmental science. It is instrumental in characterizing molecules, determining the authenticity of substances, and understanding the behavior of matter in various environments.

Materials and Techniques in Spectroscopy:

To perform spectroscopic analyses, you’ll need several key components:

  1. Light Source: An appropriate light source that emits electromagnetic radiation of the desired wavelength, such as lasers or lamps.
  2. Sample Holder: A container or device to hold the material being analyzed, ensuring consistent and repeatable measurements.
  3. Monochromator/Detector: A device that disperses the incoming radiation into its component wavelengths and detects the intensity of each wavelength.
  4. Reference Material: A substance with known properties used as a reference for calibration and comparison.
  5. Data Analysis Software: To process and interpret the spectral data obtained during the analysis.

Basic Steps in Spectroscopy:

Here’s a simplified outline of the spectroscopy process:

  1. Preparation of Sample: The sample is prepared and placed in the appropriate sample holder to ensure accurate measurements.
  2. Interaction with Radiation: The sample is exposed to electromagnetic radiation, such as visible light, ultraviolet, or infrared.
  3. Absorption, Emission, or Scattering: Depending on the type of spectroscopy, the sample will absorb specific wavelengths, emit light at certain wavelengths, or scatter the incident radiation.
  4. Measurement: The intensity of the transmitted, emitted, or scattered radiation is measured using a detector or spectrometer.
  5. Data Analysis: The collected data is analyzed to identify characteristic features or absorption/emission bands, and the information is used to determine the properties of the sample.
  6. Comparison to Reference: The obtained spectral data is often compared to reference spectra to identify specific compounds or verify the authenticity of the material.
Categories
common assays

Cell culture assays

Overview

Cell culturing is a fundamental technique used to grow and study cells in a controlled laboratory environment. It involves the cultivation of cells outside their natural environment, providing researchers with a controlled setting to study cell behavior, responses to various treatments, and cellular interactions. Cell culture assays are invaluable in understanding cell physiology, cell signaling, drug responses, and disease mechanisms. They allow researchers to investigate cell growth, viability, migration, and other cellular processes under different experimental conditions. They find extensive applications in areas such as cancer research, drug development, regenerative medicine, and toxicology studies, playing a critical role in disease modeling, drug screening, and exploring the impact of genetic or environmental factors on cell behavior.

The density of cells in a culture is called confluency!

Materials and Equipment in cell culturing:

To perform cell culture assays, you’ll need several key components:

  1. Cell Lines or Primary Cells: The cells of interest, either from established cell lines or isolated from tissues.
  2. Culture Medium: A nutrient-rich solution containing essential growth factors, hormones, and other supplements to support cell growth.
  3. Cell Culture Flasks or Plates: Containers where cells are cultured, providing a stable environment for cell attachment and proliferation.
  4. Incubator: An apparatus to maintain optimal temperature, humidity, and gas concentration for cell growth.
  5. Cell Counting and Viability Assays: Tools and reagents to determine cell number and assess cell viability.
  6. Microscope: To observe cell morphology and monitor cell health during the culture process.

Basic Steps in cell culturing:

Here’s a simplified outline of the cell culture assay process:

  1. Cell Seeding: Cells are seeded onto culture flasks or plates at an appropriate density to ensure optimal growth and confluence.
  2. Cell Growth and Maintenance: Cells are incubated in a controlled environment, providing them with the necessary nutrients and conditions for growth and proliferation.
  3. Cell Treatment: Cells may be exposed to different substances, drugs, or stimuli to study their responses and behavior under specific conditions.
  4. Cell Imaging and Observation: Microscopy is used to observe cell morphology, monitor cell health, and track changes during the culture period.
  5. Cell Viability Assessment: Cell viability assays are performed to determine the number of viable cells and assess cell health.
  6. Data Collection and Analysis: Data on cell growth, viability, and other experimental outcomes are collected and analyzed, providing insights into the effects of treatments or conditions on the cultured cells.

Cell culturing is a cornerstone of modern biomedical research, offering a controlled and reproducible platform for investigating various cellular processes.

Categories
common assays

Fluorescence Resonance Energy Transfer (FRET)

Overview

Fluorescence Resonance Energy Transfer (FRET) is a powerful spectroscopic technique used to study molecular interactions and conformational changes in biological systems. It enables researchers to investigate molecular interactions and distances within biomolecules, relying on the transfer of energy between two fluorophores – a donor fluorophore and an acceptor fluorophore – when they are in close proximity. FRET provides valuable information about molecular interactions, protein-protein binding, DNA-protein interactions, and conformational changes in macromolecules. It allows researchers to measure distances between molecules within nanometer ranges, offering insights into dynamic cellular processes. FRET finds extensive applications in cell biology, biophysics, structural biology, and drug discovery. It is instrumental in studying protein-protein interactions, membrane dynamics, enzymatic activities, and intracellular signaling events.

Materials and Techniques in FRET:

To perform FRET experiments, you’ll need several key components:

  1. Fluorophores: Two fluorophores – a donor and an acceptor – that can absorb and emit light of different wavelengths.
  2. Excitation Source: A light source, such as a laser or a lamp, to excite the donor fluorophore.
  3. Optical Filters: Filters to selectively detect the fluorescence emission from the donor and acceptor fluorophores.
  4. Detector: A photodetector or a camera to measure the emitted fluorescence signals.
  5. Control Experiment: A negative control to account for any non-specific interactions or background noise.

Basic Steps in FRET Experiments:

Here’s a simplified outline of the FRET experiment process:

  1. Fluorophore Labeling: The molecules of interest are labeled with the donor and acceptor fluorophores. The donor absorbs light and transfers energy to the acceptor fluorophore if they are in close proximity.
  2. Excitation: The sample is illuminated with the excitation light, exciting the donor fluorophore.
  3. Energy Transfer: If the donor and acceptor fluorophores are close enough, energy transfer occurs from the excited donor to the acceptor, resulting in fluorescence emission from the acceptor.
  4. Emission Detection: The emitted fluorescence signals from both the donor and acceptor are detected using appropriate optical filters and a photodetector.
  5. Data Analysis: The FRET efficiency is calculated based on the ratio of acceptor fluorescence to donor fluorescence. This efficiency correlates with the distance between the fluorophores and provides information about molecular interactions.

FRET is a powerful technique that allows researchers to explore molecular interactions and dynamic processes at the nanoscale level. It has significantly advanced our understanding of cellular functions and protein behavior, contributing to various discoveries in biomedical research and drug development.

Categories
common assays

Bradford Assay

Overview

Bradford Assays are a widely used method for protein quantification in the field of biochemistry. It’s common and sensitive technique employed to determine the concentration of proteins in a sample. This colorimetric (numeric measurement of color) assay relies on the binding of Coomassie Brilliant Blue dye (a common type of dye) to proteins, resulting in a color change that can be measured and correlated to the protein concentration. Bradford Assays provide researchers with a quick and reliable method to quantify the amount of protein in a given sample. It is particularly useful in protein purification, protein expression studies, and protein quantification in various biological and biochemical experiments. They find applications in numerous fields, including biochemistry, molecular biology, proteomics, and pharmaceutical research. They are vital in protein purification workflows, assessing protein yield, and determining protein concentrations for downstream applications.

Materials Required for Bradford Assays:

To perform Bradford Assays, you’ll need several key components:

  1. Protein Sample: The solution containing the protein of interest that needs to be quantified.
  2. Bradford Reagent: The Coomassie Brilliant Blue dye solution, which binds to proteins and undergoes a color change upon binding.
  3. Spectrophotometer or Plate Reader: To measure the absorbance of the sample at specific wavelengths.
  4. Microplate or Cuvettes: Containers to hold the sample and reagents during the assay.
  5. Bovine Serum Albumin (BSA) Standard: A known concentration of BSA protein used to create a standard curve for protein quantification.

Basic Steps in Bradford Assays:

Here’s a simplified outline of the Bradford Assay process:

  1. Prepare Standard Curve: Prepare a series of known concentrations of BSA (standard) and measure their absorbance at a specific wavelength using the spectrophotometer. This data will be used to create a standard curve relating absorbance to protein concentration.
  2. Prepare Sample: Dilute the protein sample to be quantified to ensure it falls within the linear range of the standard curve.
  3. Add Bradford Reagent: Mix the sample with the Bradford reagent, allowing the dye to bind to the proteins.
  4. Incubation: Incubate the sample and Bradford reagent mixture for a specific period to allow sufficient color development.
  5. Measure Absorbance: Measure the absorbance of the sample at the appropriate wavelength using the spectrophotometer or plate reader.
  6. Calculate Protein Concentration: Use the standard curve to correlate the absorbance value of the sample with the corresponding protein concentration.

Bradford Assays offer a simple and accurate method for protein quantification, enabling researchers to analyze and compare protein concentrations across various samples. This technique plays a crucial role in protein-related research, facilitating the understanding of cellular processes, disease mechanisms, and the development of therapeutic interventions.

Categories
common assays

Real-time PCR/qPCR

Overview

Real-time PCR, also known as quantitative PCR (qPCR) or RT-PCR, is a versatile and widely used molecular biology method that enables researchers to amplify and quantify DNA in real-time during the PCR process. It allows for the accurate determination of the initial amount of DNA in a sample and provides insights into gene expression levels, genetic variations, and pathogen detection. RT-PCR provides valuable information about gene expression, viral load, DNA mutations, and relative amounts of specific DNA sequences. It allows researchers to measure DNA amplification as it occurs, enabling quantification with high sensitivity and specificity. RT-PCR finds extensive applications in genomics, molecular diagnostics, microbial detection, and genetic research. It plays a crucial role in studying gene expression patterns, validating microarray data, identifying pathogens, and analyzing genetic mutations.

Materials and Equipment in RT-PCR:

To perform RT-PCR, you’ll need several key components:

  1. DNA Sample: The DNA of interest, which may be genomic DNA, cDNA reverse transcribed from RNA, or DNA from other sources.
  2. Primers and Probes: Short DNA sequences specific to the target region of interest, which are essential for amplification and detection.
  3. DNA Polymerase: An enzyme responsible for DNA synthesis during the PCR process.
  4. Fluorescent Dyes or Probes: Molecules that emit fluorescence when bound to the amplified DNA, allowing real-time detection of DNA amplification.
  5. Thermal Cycler with Optical Detection: The RT-PCR instrument that automates the cycling and fluorescence detection.
  6. Reference Material (if applicable): A standard sample or a dilution series of known DNA concentrations used to create a standard curve for quantification.

Basic Steps in RT-PCR:

Here’s a simplified outline of the RT-PCR process:

  1. Primer Design and Sample Preparation: Design and select specific primers and probes to target the DNA region of interest. Prepare the DNA sample to be analyzed.
  2. Reaction Setup: Combine the DNA sample with the primers, DNA polymerase, and fluorescent dyes or probes in a reaction mix.
  3. PCR Amplification and Fluorescence Detection: Perform the PCR amplification cycles in the RT-PCR instrument while simultaneously detecting the fluorescence emitted during amplification.
  4. Data Collection and Analysis: The RT-PCR instrument records the fluorescence signal at each cycle. Analyze the data using specialized software, which provides information on the initial DNA concentration and relative gene expression levels.
  5. Quantification (if applicable): If quantification is required, use the standard curve generated from the reference material to calculate the absolute DNA concentration in the original sample.
Categories
common assays

Immunofluorescence assay

Overview

The Immunofluorescence Assay (IFA) is a widely used and versatile laboratory method that enables researchers to visualize the presence and distribution of specific antigens or proteins in biological samples. It utilizes fluorescently labeled antibodies that bind to the target molecules of interest, allowing for precise and sensitive detection. IFA provides valuable information about the spatial distribution and localization of specific antigens or proteins within cells or tissues. It is used to study protein expression patterns, cellular structures, and subcellular localization in various research areas. IFA finds extensive applications in cell biology, immunology, neuroscience, and pathology. It is instrumental in studying cellular signaling pathways, protein-protein interactions, cellular dynamics, and the effects of various treatments on cellular components.

One of the Scientia writer’s own experiments!

Materials and Components in IFA:

To perform an IFA, you’ll need several key components:

  1. Primary Antibodies: Specific antibodies that bind to the target antigens or proteins of interest.
  2. Secondary Antibodies: Fluorescently labeled antibodies that recognize and bind to the primary antibodies.
  3. Blocking Agent: A solution used to block non-specific binding sites and reduce background noise.
  4. Permeabilization and Fixation Reagents: To enable antibody penetration and preserve cell/tissue structures.
  5. Fluorescence Microscope: The microscope equipped with appropriate filters for excitation and emission of the fluorescent labels.

Basic Steps in IFA:

Here’s a simplified outline of the IFA process:

  1. Sample Preparation: Cells or tissue sections are fixed and permeabilized to preserve cellular structures and allow antibody penetration.
  2. Blocking: Non-specific binding sites are blocked with a blocking agent to minimize background fluorescence.
  3. Primary Antibody Incubation: The sample is incubated with specific primary antibodies that bind to the target antigens or proteins.
  4. Washing: Unbound primary antibodies are washed away to reduce background signals.
  5. Secondary Antibody Incubation: The sample is incubated with fluorescently labeled secondary antibodies that bind to the primary antibodies.
  6. Washing: Unbound secondary antibodies are washed away to reduce non-specific signals.
  7. Mounting: The sample is mounted with a suitable mounting medium to preserve the fluorescence signal.
  8. Imaging: The sample is observed under a fluorescence microscope, and the fluorescence signals emitted by the bound antibodies are detected.
  9. Data Analysis: The images are analyzed to determine the localization and distribution of the target antigens or proteins.

Its ability to provide detailed spatial information has significantly contributed to our understanding of cellular structures and functions, advancing research in various disciplines, including cell biology, immunology, and neuroscience.